Case studies

Our open data in action

Open data only matters when it's used. This page showcases how planners, researchers, innovators, and community groups are applying our datasets to solve problems speeding up local energy planning, unlocking low-carbon investment, and improving public services.

Quantail: Curtailment Modelling & Financial Translation
Quantail Logo

Curtailment Modelling & Financial Translation

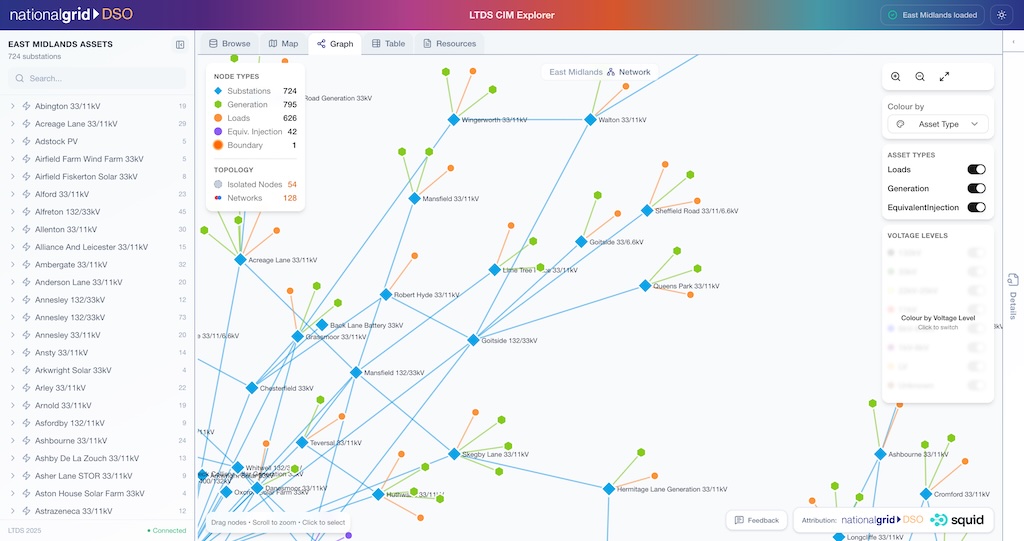
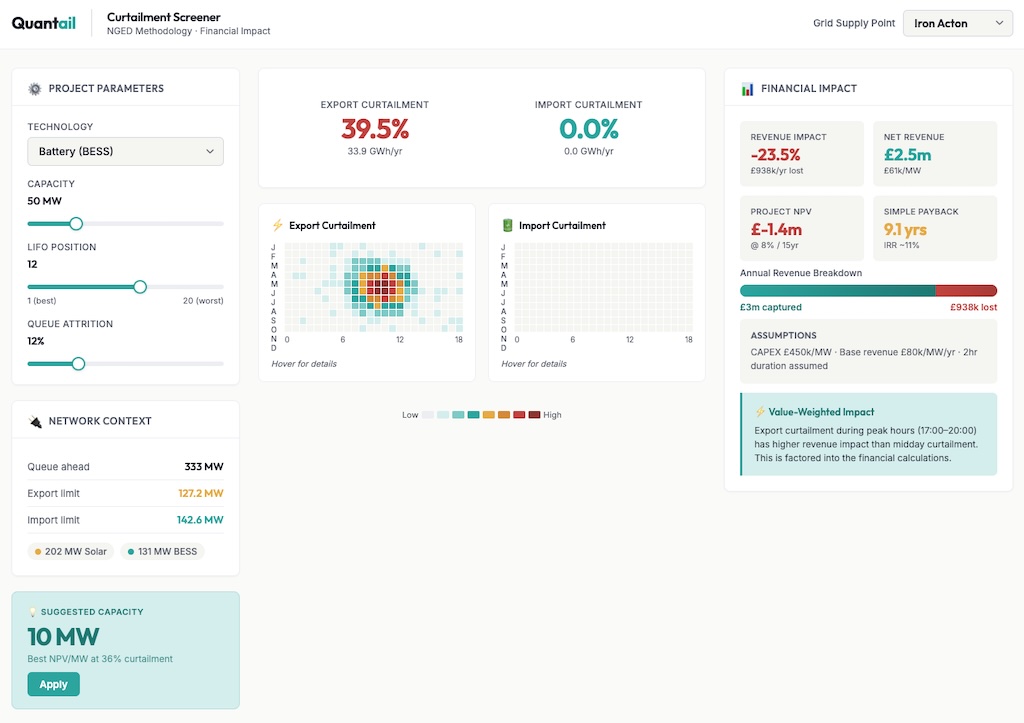
Quantail built a real-time curtailment modelling tool anchored to our empirical power-flow and headroom data, including substation and branch loading, technology profiles, sensitivities and Gate 2 queue positions.

The tool shows how key drivers such as LIFO queue order and queue attrition influence curtailment outcomes and, crucially, how those outcomes flow into revenue, cash flow, IRR and NPV for different asset types, sizes and GSP locations.

Impact

  • High-speed Stage-1 screening for BESS and solar projects.
  • Clear translation of constraint scenarios into value metrics.
  • Supports challenge-based early decision-making ("Is this project likely to get kneecapped by constraints?").
View case studies

Datasets used

Connection Queue, Substation Loading, Branch Loading, Sensitivity Factors, Asset Limits, Generic Generator Profiles

"This is a first-of-its-kind tool that visually and instantly translates curtailment into the financial metrics investors rely on."

— Henry Easterbrook, CEO
Squid: LTDS CIM Explorer
Squid Logo

LTDS CIM Explorer

In partnership with National Grid, Squid Labs has developed an interactive tool for exploring and interacting with our latest Long-Term Development Statement (LTDS). This marks an important milestone as we begin publishing these models in the rapidly evolving LTDS Common Information Format (CIM) format.

The tool has been built alongside the LTDS CIM schema, with functionality aligned to both presently available and future data published according to the LTDS Stage 1, 2 and 3 roadmap.

Impact

  • Quick and intuitive access to planning models and related data.
  • A geospatial view to help identify prospective connection points.
  • Enables advanced use cases through enrichment with additional datasets.
Explore LTDS CIM

Datasets used

LTDS Common Information Model, Primary Substation Location

Squid: Flex Portal
Squid Logo

FlexPortal - Making flexibility data more dynamic and interactive

In partnership with Squid we've launched the new FlexPortal, a major step forward in how we share data, insights and market intelligence with our stakeholders. The new portal enables stakeholders to easily access flexibility data, dispatch patterns as well as the outcome of the DSO's largest long-term flexibility tender to date, providing greater transparency ahead of delivery from April 2026.

The new tool transforms the traditional static report into a dynamic, data-rich experience, enabling users to explore dispatch, participation, and tender outcomes visually and interactively.

Impact

  • Clear, intuitive visibility of flexibility activity through a dynamic, interactive interface.
  • Unlocking more value from our data, supporting clearer, more consistent decision-making.
  • More insightful data helps providers, customers and partners to better engage with our flexibility markets.
Explore the Flex Portal

Datasets used

Connection Queue, Substation Loading, Headroom

"The new FlexPortal was shaped by what stakeholders have repeatedly emphasised, the need for more dynamic and intuitive access to information beyond traditional static reports and spreadsheets. As we add further datasets over the coming months, the Portal will deliver even greater value to market participants."

— Doerte Schneemann, Head of Flexibility Markets

Who uses our open data

  • Local Authorities
  • Energy Consultants
  • Researchers
  • Flexibility Service Providers
  • Startups
  • Community groups

Share your story

Have you used our open data? We'd love to feature your work.